Argentina Cuts Gas, Closes Border As Cold Wave Hits; Australia And New Zealand See Deep Early Powder; + Spot The UHI Effect
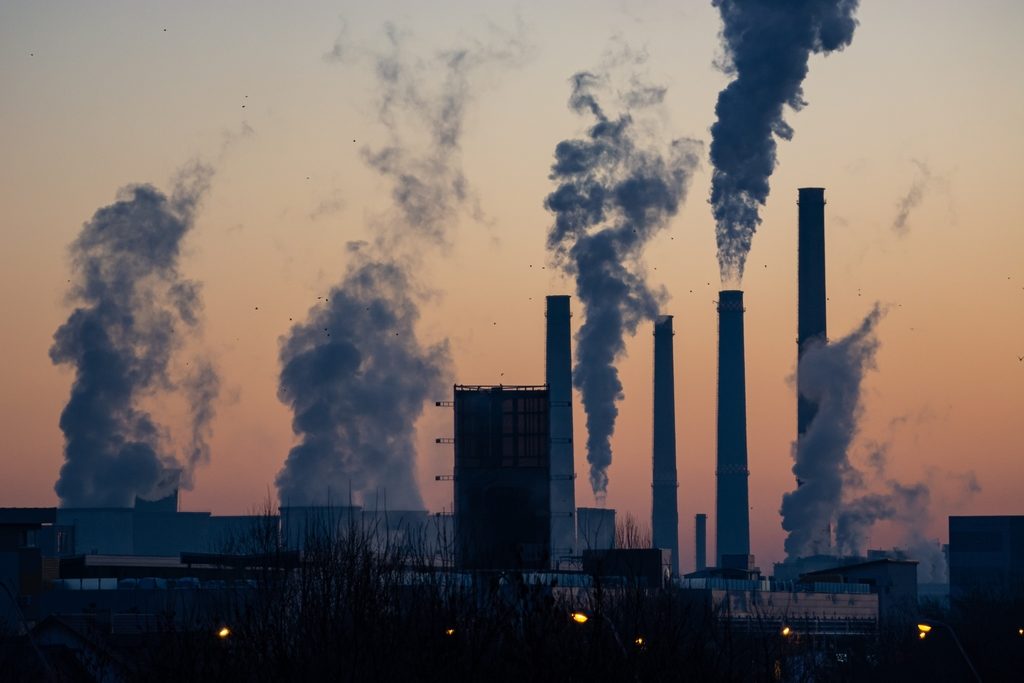
This isn’t climate. It’s concrete.
This isn’t climate. It’s concrete.
Anything that can be taxed will be taxed, even down to the building blocks of life—carbon and water.
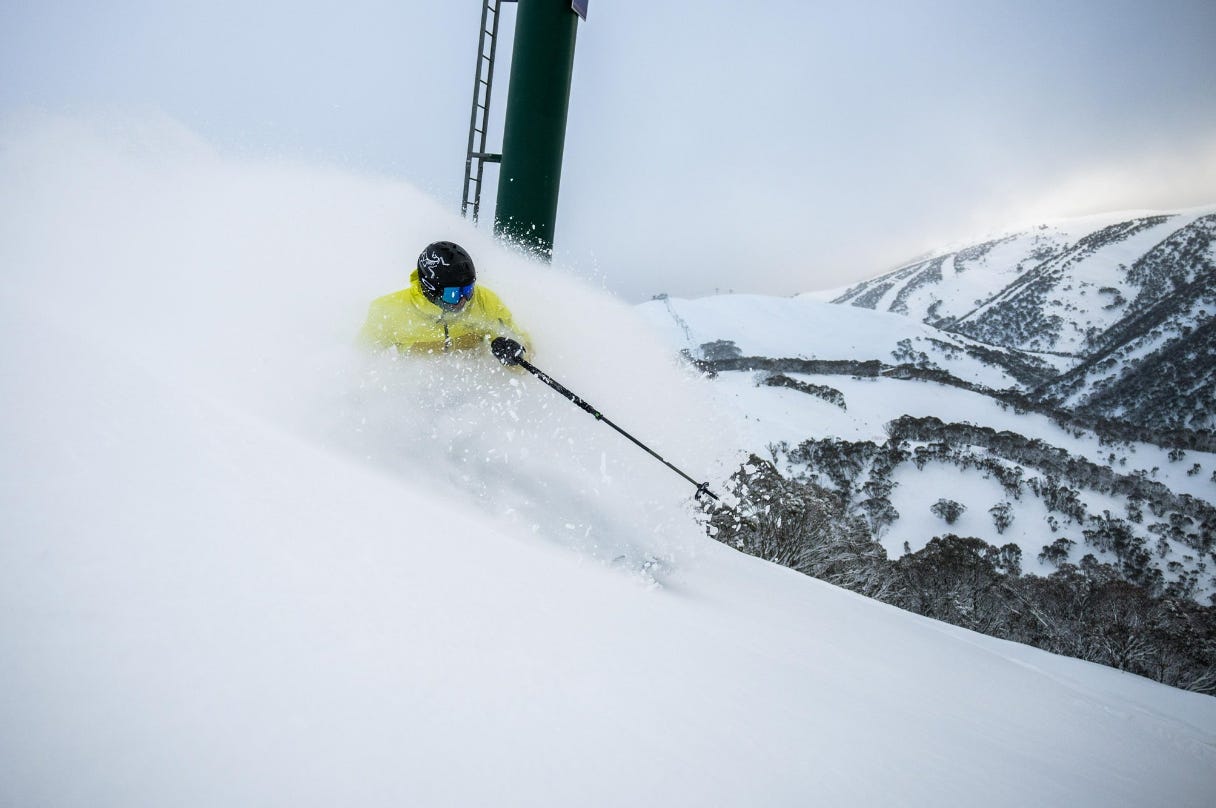
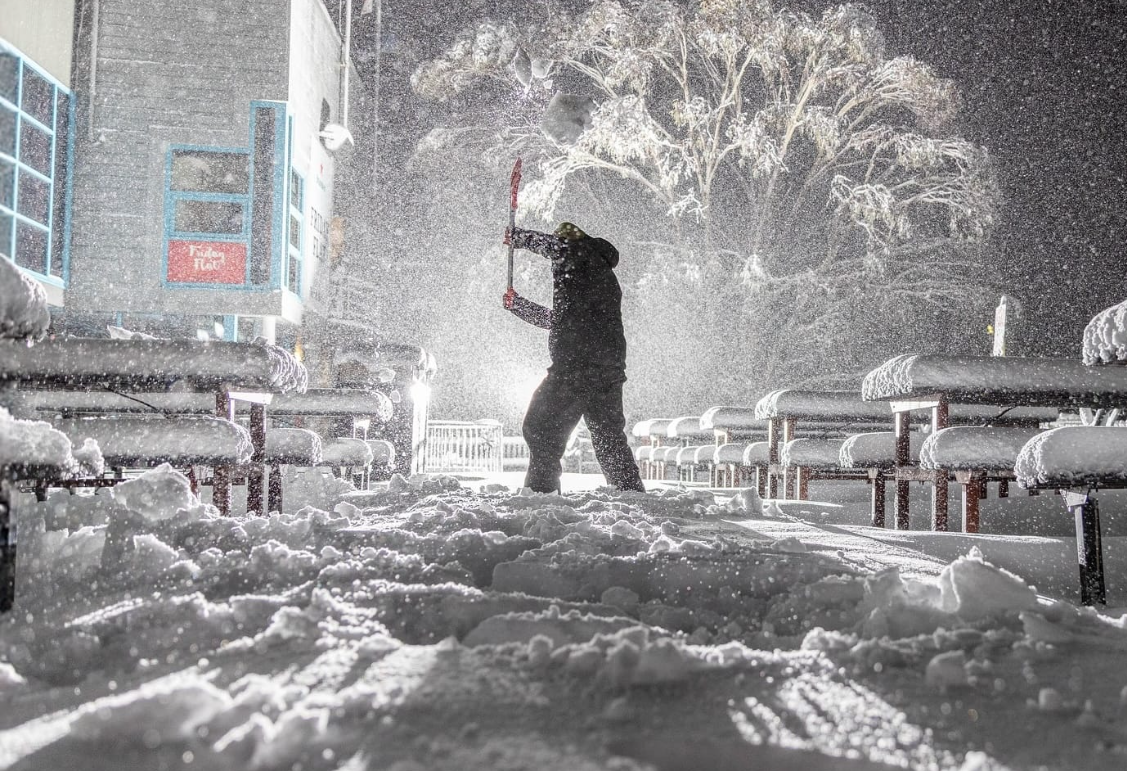
Owing to the record cold, Australia's SE peaks have been receiving rare 'powdery' snow.
Climate models continue to predict the opposite of what we're seeing.
 Unlock with Patreon
G’day Cap,
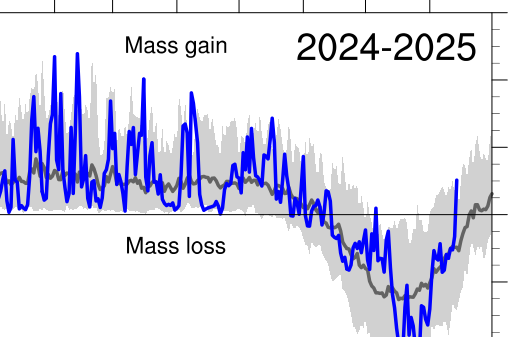
JoNova posted an article today concerning ice loss at Antarctica
“Suddenly 1.5 million square km of sea ice is missing near Antarctica and all the climate models were wrong”
The discussion centred around salinity, heating oceans etc.
Your comments would be appreciated
If surface salinity is increasing the most simple explanation would be less freshwater melt off the continent.
As the 1970’s were a colder period there would have been increased fresh water release since then.
The other potential elephant in the room could be a decline in geothermal activity means less fresh water melt.
The greatest oceanic overturning occurs in drake passage and up the coast from there but this appears to be decadal so moon cycles and El Nino type events seem less likely to be causal.
Start with the most simple hypothesis. A more complex explanation is usually a number of contributing factors, acting co-incidentally but each contributing factor being pretty simple in isolation.
Oh, so the cause of more salinity could be cooling, therefore less fresh water ice melt.
The MSLP Global map shows pretty standard winter storms around Antarctica. The most interesting thing is the North Atlantic high pressure system fitting snuggly over, and complimenting, the gulf stream.
That gulf stream ain’t going to slow down until continents move,
http://www.bom.gov.au/australia/charts/global/gmslp.000.shtml
I forgot to post the map. Dementia creep!!!
Is this the article you are referring to?:
Suddenly 1.5 million square km of sea ice is missing near Antarctica and all the climate models were wrong.
https://joannenova.com.au/2025/07/suddenly-2-million-square-km-of-sea-ice-is-missing-near-antarctica-and-all-the-climate-models-were-wrong/#comments
There is something strange about the temperature in the southern hemisphere.
The temperature in the Arctic became several degrees Celsius warmer in 2016.
In the past week, the southern hemisphere temperature anomaly has decreased by 0.5 degrees Celsius and the Arctic temperature anomaly has decreased by 4 degrees Celsius.
The southern hemisphere temperature drop in the past week has caused the global average temperature anomaly to decrease by 0.4 degrees Celsius.
Is it the temperature changes in the Arctic that are the cause of the Arctic sea ice melt?:
Arctic Sea and Sea Ice Surface Temperature anomaly time series based on reprocessed observations
31 Dec 1992 to 30 Dec 2022
https://data.marine.copernicus.eu/product/OMI_CLIMATE_SST_IST_ARCTIC_area_averaged_anomalies/description
The temperature drop over the past week in the Southern Hemisphere is only visible in the daily temperature graph.
Most temperature graphs only show monthly temperature graphs or average temperature for the past year.
The only temperature graph I have found that shows a daily temperature and is updated daily is oz4caster:
https://oz4caster.wordpress.com/cfsr/
The Climate Reanalyzer graph shows daily temperature for the Southern Hemisphere but the update is delayed by 6 or 7 days:
Climate Reanalyzer Daily Surface Air Temperature Southern Hemisphere.
The content on this page updates daily by about 1200 UTC with a lag time of 6 or 7 days from the current date due to ERA5’s availability from Copernicus C3S.
https://cci-reanalyzer.org/clim/t2_daily/?dm_id=sh
Pinocchio-
How am I ever to decide whether you are a real boy or just a wooden puppet?
I saw a graph of Arctic temperatures compared to Antarctic temperatures.
2016 is colder than normal in Antarctica and warmer than normal in the Arctic.
Still the ice is melting more in the Antarctica?:
Fig. 3. Annual mean temperature anomalies of the combined land–ocean for the global, Arctic (north of 64°N), and Antarctic (south of 64°S) region
https://spj.science.org/doi/10.34133/olar.0006