Avalanche At Kedarnath Temple
On Sunday morning, a large avalanche struck the snowy mountain behind Kedarnath Dham, Uttarakhand, India.
A video of the event went viral on social media.
Fortunately, no casualties or damage have been reported.
“There was no loss of life or property,” Dr. Vishakha Ashok Bhadane, the region’s senior superintendent of police.
Heavy snow has beset the region in recent weeks and months, notes disaster management officer Nandan Singh Rajwar.
The higher reaches Uttarakhand, Himachal Pradesh and Kashmir have all observed healthy snow volumes in June, with stark temperatures drop noted that are “giving Kashmir a February-like feel in June,” so said the meteorological department.
Australia’s Bitter Cold And Low Wind Leads To Power Concerns
Eastern Australia is enduring a brisk start to the season, felling record lows and defying the BoM’s winter forecast.
On one of the coldest mornings in recent years, thermometers dipped to 7.8C (46F) in Sydney. This chill is part of a broader pattern affecting much of the country, including New South Wales and Queensland, as a polar air mass and clear skies dominate.
In NWS, temperatures at Perisher Valley dropped to -4.7C (23.5F), while Sydney’s Observatory Hill posted an anomalous 8.1C (46.6F). Queensland shivered through similarly frigid conditions, with Stanthorpe hitting -2C (28.4F), the lowest reading in years.
Tasmania has also faced some of its coldest nights in years of late.
Liawanee, for example, on the Central Plateau recorded -12.1C (10.2F), just shy of breaking the state’s all-time record. Ross, with -6.5C (20.3F), experienced its coldest night in more than five years, and Launceston, with -3.1C (26.4F), had its coldest July night in 16 years.
The biting cold has also impacted Australia’s energy grid. A high demand for heating, coupled with low wind power generation, has put immense pressure on infrastructure.
A coal-rich nation relying heavily on unreliable renewables is the crux of the issue. You let a fanciful, anti-human narrative run unchecked and this is the result.
Looking ahead, the ‘blues’ and ‘purples’ are expected to persist, intensify even, into the new week, with a fresh front crossing southeastern Australia — one forecast to deliver additional anomalous lows and also substantial snows to the higher elevations.
Greenland’s Record Summer Gains
Recent data from the Danish Meteorological Institute (DMI) showcases record-breaking gains on Greenland. Contrary to mainstream foretellings, the ice sheet is posting substantial accumulations, continuing the run started in mid-May.
The latest SMB charts reveal multiple-gigaton gains on June 29 and 30, a stark contrast to the typical summer melt. These gains not only far-exceed the 1981-2010 average, they are also among the highest ever summer readings in 43-years of data.

Indeed, despite the ongoing ‘atmospheric CO2 apocalypse’, fierce chills and sizable snow dumps have worked to deliver the island its largest late-June gains in DMI books dating back to 1981.

The season overall, despite a slow spring, is now riding above the multidecadal mean:

The next chart illustrates the wider story.
It shows that Greenland has been failing to follow the prescribed melting trajectory for years now, since 2012:

According to alarmist climate models, Greenland should have experienced significant melting by now which, in turn, should have inundated coastal locales with rising seas.
But the data show nothing alarming continues to occur.
As highlighted, 2024 is resulting in additional headaches for the AGW Party. Instead of the anticipated summer melt, Greenland is seeing a late pickup, leading to above-average mass, reinforcing the inconsistency between climate reality and climate models.
The dire predictions of Greenland’s imminent melting are not materializing.
The same can be said for the Arctic. Recent data here indicates that the Arctic sea ice melt since the summer solstice has been the slowest in almost three decades.
The below chart, which comes courtesy of Tony Heller, shows summer sea ice melt from June 21 to June 29 for each year dating back to 1997. Clearly visible, 2024’s melt rate is exceptionally slow; extent is significantly higher than in the past 27 years

The slowest Arctic melt in nearly three decades and record summer gains on Greenland highlight the absurdity of attributing complex climate phenomena to a single forcing (CO2), exposing the simplistic nature of mainstream climate science.
Cooler atmospheric conditions, the jet stream, variations in ocean currents, and healthy Hemisphere-wide snow cover are likely contributing to these anomalies. The same can also be said for the record cold experienced the past few years on Antarctica.
Incoming CMEs And The Approaching Solar Max
Three Coronal Mass Ejections (CMEs) that left the Sun over the past few days are expected to graze Earth’s magnetic field July 1 through 3, as the Solar Maximum of Cycle 25 continues.
The most significant impact is likely on July 3, stemming from a CME hurled into space by a magnetic filament eruption in the Sun’s southern hemisphere. Minor G1-class geomagnetic storms are possible leading up to the Fourth of July.
As of mid-2024, solar activity has notably increased, suggesting we are approaching the peak of Solar Cycle 25.
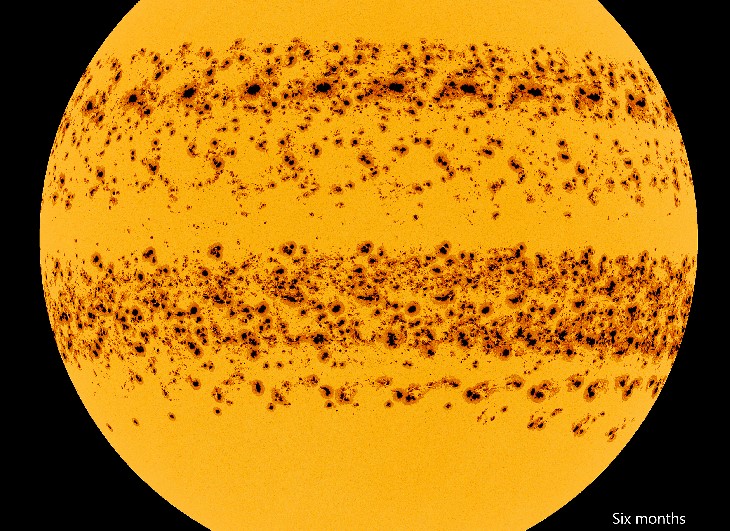
As reported by spaceweather.com, amateur astronomer Eduardo Schaberger Poupeau has compiled daily images of the Sun for the first six months of the year, creating a composite image that vividly illustrates the heightened activity:

Rafaela, Provincia de Santa Fe, Argentina, June 30, 2024
[Eduardo Schaberger Poupeau]
Poupeau comments, “Since the beginning of 2024, the Sun has increased its activity. The presence of so many sunspots is a clear indication that we are close to the maximum activity of Solar Cycle 25.”
The composite image reveals two significant patterns.
First, sunspots are concentrated in two distinct bands, one north and one south of the Sun’s equator. As the solar cycle progresses, these bands will converge at the equator, ultimately neutralizing each other in a collision of opposite-polarity magnetic fields. This convergence will mark the transition from Solar Maximum to Solar Minimum.
Second, the southern hemisphere is exhibiting more sunspots than the northern hemisphere. This imbalance is not unusual, as one hemisphere can dominate sunspot activity for extended periods. In this instance, the disparity is largely due to a massive southern sunspot (AR3664) that circled the Sun three times, significantly boosting the southern sunspot count.
Solar Maximum is still unfolding, with some models predicting it could persist for another 2 years. It is possible we have peaked in terms of strength, but a period of relatively high activity is set to persist until ≈2026, meaning continued flare danger.


Hi !
Thx for the paper, Cap.
Experimental question here : Is the flare intensity linked to the number of sunspots ? Were flares more intense during the previous solar maxes ?
I wondered if by using the live space weather overview we could plot a 2d curve.
Best,
I watched the presidential debate hoping that Trump
would challenge Biden on run away global warming. Instead he danced around the issue just like he did in 2020 asking for clean water.
If elected I hope that the Trump Justus department will look into the claims that the government was using funding threats to coerce scientist and institutions into supporting their run away global warming fantasy. A fantasy that very soon may have deadly consequences.
Very soon what year? What year will it snow here all Summer according to the experts? Robert Felix said 2016 it would snow here all Summer and forever more but it got record hot. Hot every Summer here since ’12. When exactly what year am I sposed to be worried about now?
I could not watch the debate. Couldn’t pay me to watch that crap. Joe has the nuke controls and is not fit to do so his only way out is hit the button before they take it from him. VP’s an idiot UN CIA plant. Worser.
I looked up the Kedarnath Temple, no roads to it elevation 11,755ft, mountains around seventeen to twenty thousand feet. They have gravity there.
https://en.wikipedia.org/wiki/Kedarnath_Temple
Geomagnetic storms are down despite sunspots being numerous.
On the following site solar flaring is also low even though sunspots are numerous.
https://www.solarham.com/
Because of all the above the OULU count is -3.9 only 5 increments from going into their version of positive territory.
https://spaceweather.com/
Things are marginal right now. We may move to another peak or slide into a downward temperature trajectory.
One thing is for sure. In the ever more likely event of a nuclear war. We can defend ourselves if Jill can remember the codes!
Bless you, my son. Pearls of wisdom drip from your typing fingers. What do you say we turn our faces from this cruel and evil world and go on pilgrimage to Kedarnath? In my youth I aspired to become a Buddhist monk, in those days I was somewhat hampered by my inappropriate gender. Perhaps the entrance regulations have since loosened. (If not, I can probably sue them for discrimination.)
Perhaps their altitude will be sufficient protection from the fray when the SHTF. If the shelves go empty at the local Walmart, we can just fast for enlightenment. Win/win.🧘
(In case anyone’s wondering, that was addressed to Dirk. He finally said something I could agree with!)
New dots:
https://www.swpc.noaa.gov/products/solar-cycle-progression
If you think 2016 was hot I hate to see what 1993 would have done to you…🤪
I was working out in it every Summer. And the cool summers. Look at UAH GT for 1993 it was below ave 2016 was the new record on the chart after the ’98 El Nino. 2020 was also warm in solar min in La Nina.
Cold very soon, what year? What year will it snow here all summer from GSM?
The CIA, Pentagon and the Federal Reserve support UN climate policies which they enforce and fund. They invented it to print money. Anybody that doesn’t like it gets taken out. Never going to get rid of the CIA the Fed and the Pentagon.
https://www.cnbc.com/2024/03/01/the-us-national-debt-is-rising-by-1-trillion-about-every-100-days.html
Mystic –
I’m about to give up on you. When are you going to realize that trump and biden are but two arms of the same octopus? Or rather, all of those in charge, here and abroad, are but separate snakes on Medusa’s head. They despise you. They are not going to help you unless it furthers their plan to scam you. Wake up!
The republicans including Trump are remaining tight lipped about the approaching minimum.
Normal solar minimum years away, non issue.
Republicans vs Democrats is simply a ploy to engage the passions of the marching morons and keep them from looking behind the curtain. I see it’s working.
ARTICLE
Six years later, New York Times mentions that the Maldives is not sinking
https://clintel.org/six-years-later-new-york-times-mentions-that-the-maldives-is-not-sinking/
Polarity solar min ’09:
https://gong.nso.edu/data/magmap/QR/mqf/200909/mrmqf090929/mrmqf090929t2143c2088_000.gif
Polarity solar min ’19:
https://gong.nso.edu/data/magmap/QR/mqf/201901/mrmqf190130/mrmqf190130t1201c2213_000.gif
Today’s view, waiting for red back on top then watch it flip again for ten years next decade.
https://gong.nso.edu/data/magmap/QR/bqf/202407/mrbqf240701/mrbqf240701t1414c2286_278.gif
Hurricane gusting 145mph headed for Jamaca, Mexico. From a solar flare. 111F in Africa on the Atlantic Coast, 118 N Africa, 120F Iraq. 120F Pakistan.
https://www.wunderground.com/hurricane/atlantic/2024/hurricane-beryl
What solar flare is that hurricane from?
https://www.youtube.com/watch?v=sHbnXZE0Vdw
https://www.youtube.com/watch?v=YqPMtjU8FEg
Go to Space Weather.com archives for June 27th top news item GEOMAG Storm watch predicted G1storm. They show the flare there twice:
https://www.spaceweather.com/images2024/25jun24/partialhalo.gif
https://www.spaceweather.com/images2024/25jun24/filament_crop.
Convection from heat. Ocean temp W Africa 87F and solar forcing adds heat for convection. If the hurricane now gets hit with another flare it adds more heat causes convection evaporation makes it stronger. Heat driven cyclones.
Predicted G1 GEOMAG storm from a filament solar flare turned out to be a G4 Kp8 GEOMAG storm because of the weak mag shield a blast of heat causing ocean convection and a hurricane. Temps in W Africa on the Atlantic 111F. heat going over the Atlantic from Africa 118 F N Africa.
The pattern heads West to the heat in Mexico rising into N America. Circulation. Azores volcano also still hot adding to the heat.
https://www.youtube.com/watch?v=m8CjSN6nOKs
Solar wind spike from flare on the chart on Space Weather News only 660kps but the solar wind density went to 65 protons per cm. I commented on that when it was happening and put up the chart showing it right before the kp8.
https://solen.info/solar/images/swind.png
It was a filament solar flare eruption not from a sunspot. Go to Spaceweather.com Archives June 25th you can see the filament lower left corner on the Coronal Hole pic for the day. The dark stripes lower Sun are the filaments. Filaments are the polar fields you can see it on GONG go back to June 25th when the flare blasted here it is:
https://gong.nso.edu/data/magmap/QR/bqG/202406/mrbqG240625/mrbqG240625t0814c2285_000.gif
https://gong.nso.edu/data/magmap/combo_gmodel_movie.html
https://gong.nso.edu/data/magmap/movie.html
That is called SMER in Africa. Heck the Anvil is at 120+F!
Yes it is summer. Fortunately nothing like the 1930’s when a massive long lived heat wave smothered the northern hemisphere. Me? I am preparing for the cold to come. The Southern Hemisphere is giving us an early warning.
I bought a big woodstove six years ago, came with a house in the forest and an endless supply of firewood. All I have to do it get it in my yard split and stack it then shove it in the woodstove 24/7 from Oct to April. I already split and stacked enough for next Winter even if it snows through next Summer. I only build small fires in the big woodstove it gets too hot in here.
There’s 80 acres of oysters and clams across the street on the tide flats where the river comes in and an Elk herd of fifty live in this river basin. Many herds along the strip it’s the National Forest. Wilderness for 60 miles behind me. I has a 4X4 350ci with 4 studs and chains. I run dozers I can move snow put a plow onmy truck no prob. Tambora year without summer probably from solar flare so I watch all the flares and volcanos. Big alignment this Dec could cause flares and volcanos Tambora type might snow for three years. I skied after Pinatubo blew and it was great! Waist deep powder. I worked outside through the La Ninas and El Ninos solar max and mins since the 60s. Skied year round on Mt Baker Wa has world record snowfall. Start of Summer now hot form solar flares. Our snowpack is zero percent of normal. Waiting for it to get cold please hurry so my well does not go dry.
Sounds like you are well situated for everything but a forest fire or a tsunami, Dirk. Oh well, no place is perfect.
Beach across the street, water is two miles across six hundred feet deep no fires out there no tsunami here I can go up on the mountain if there is a hundred foot high tide. Ain’t scared of nothing.
Haven’t you lived long enough yet to learn that the thing that gets you is the one thing you didn’t think to prepare for?
But all in all, you seem to be well situated. Good luck with that.
I drove track trucks for years when it gets to skanky better be on tracks. I dug the first one I drove out of the snow in ’75 it was buried had to find it with a rod.
https://www.machinerytrader.com/listing/for-sale/234526649/1997-komatsu-cd60r-crawler-carriers
The new snow groomer machines at ski areas are beyond amazing I want to drive one so bad I watch em at night on the ski cams. We used to have four track machines and tow rollers knock the air out of the snow. One week it snowed twenty seven feet at Stevens Pass I got to ride in a snowcat in it. I like to ski 90 miles an hour as fast as humanly possible full tuck. Ready and waiting for snow since way before black and white TV remote controls invented.
Record Cali snow from volcanos from solar flares. They went from drought to overflowing from volcanos. Hawaii and Kamchatka. Cal got rescued with help from :
https://www.bing.com/videos/search?q=heavydsparks+cali+snow+resscue&qpvt=heavydsparks+cali+snow+resscue&FORM=VDRE
My kinda guys, biggest snowcat in the world, Chinook Helicopters, snowplows, dozers, excavators, trucks, track trucks. Mountain rescue experts.
Dream machines: After driving machines in the mud forever trying to build construction projects to drive one of these new snowcats in pure fresh snow
just good clean fun. Bring on the snow I love snow. No snow here last winter no snowpack now.
https://th.bing.com/th/id/R.638d41569658dba18abccf86108c6256?rik=VH1HEu%2f7f2qppQ&pid=ImgRaw&r=0
https://th.bing.com/th/id/R.ea9151c7b971c0f18f8f6e9da3b05bc3?rik=qudUHfOkA4KQLg&pid=ImgRaw&r=0
https://th.bing.com/th/id/R.337ef87d754faade5ab1d6d37ff14ce5?rik=DwYskCbIuEspRw&pid=ImgRaw&r=0
Bet they’ve got great skiing up at the Kedarnath Temple. 😂😂😂
No roads, hike up ski all you want year round. Snow at twelve thousand feet not GSM cooling . Drivel about drivel.
Another Schumann spike yesterday I go off apparently:
https://www.youtube.com/watch?v=APg_t9EAPV4
This guy doesn’t think he was cognitively impaired by the high Schumann spikes. But he thinks we may be moving into another dimension, so I would have to respectfully disagree.
Go ski Mt Baker Wa all summer don’t have to go to Himalayas. The salmon are in the river at the base they’re coming in now the Skagit River Chinooks and Sockeyes are in Baker Lake. Eating salmon good for you better than eating snow.
https://www.bing.com/search?q=sockeye+salmon+baker+lake&cvid=5bc7546c2de24f018a773bae6f6c80a3&gs_lcrp=EgZjaHJvbWUyBggAEEUYOdIBCTIwMzA5ajBqNKgCCLACAQ&FORM=ANAB01&PC=U531
Yeah, but in the Himalayas we’d get to wear those sexy robes, lol! 😉