Rare Snow Blankets Canary Islands
The Canary Islands, a Spanish owned chain off Africa’s northwest coast, have been hit with a rare blast of snow.
Mount Teide in Tenerife was transformed this week, with the typically sun-drenched volcano standing blanketed in snow.
Temperatures have tanked across the islands, with Spain’s national weather agency, Aemet, issuing rare snow warnings for Tenerife and La Palma. Authorities even closed access to Teide National Park due to icy roads and snow, another rare occurrence.
Forecasters predict calmer conditions Wednesday, though the cold will remain.
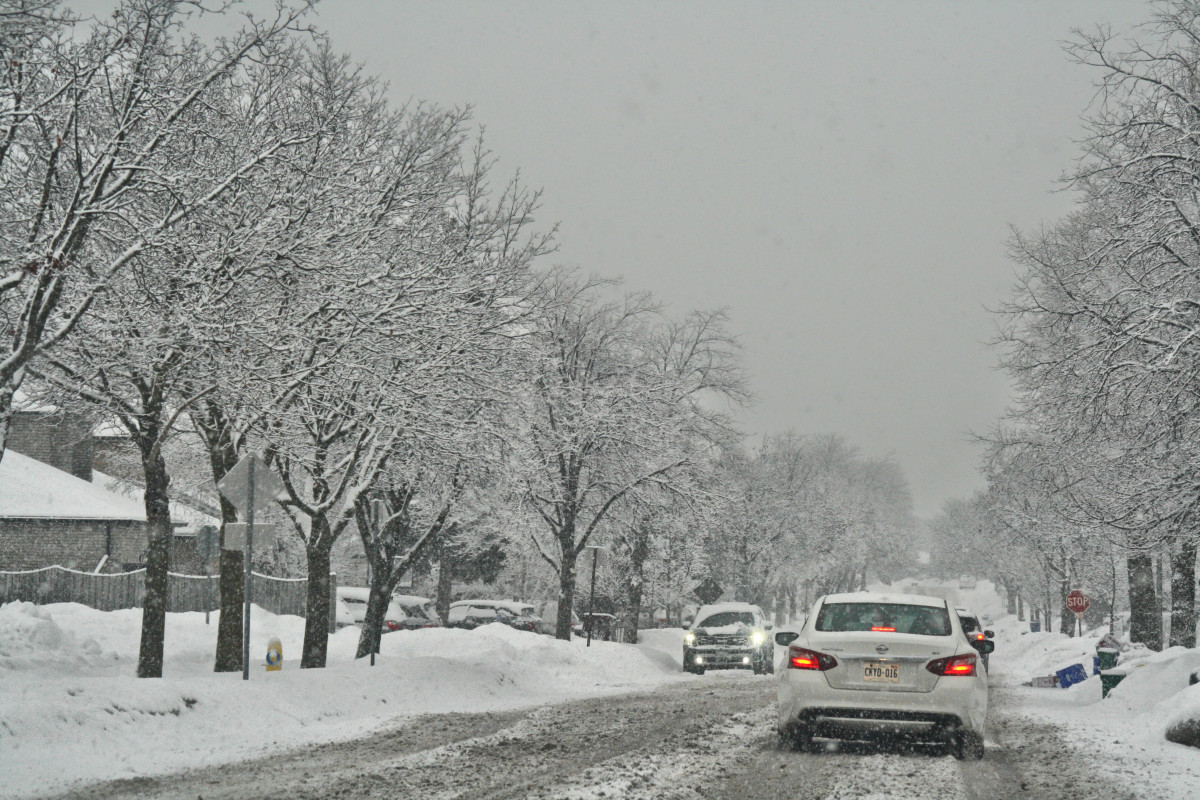
Winter Storm Slams U.S.
This week, a powerful winter storm is unleashing strong winds, heavy March snow, and brutal cold from the Rockies to the Midwest. Wind chills are biting, travel treacherous, and power outages widespread.

Heavy snow and 60+ mph winds are battering the likes of Colorado, Nebraska, and the Dakotas. Visibility is near zero, roads impassable, and power lines down. The Palmer Divide and eastern Colorado face towering drifts, while Denver is seeing a rain-snow mix turning icy.
The storm swept the Plains Tuesday, dumping over a foot of snow in some areas.
Chicago and Milwaukee could see record-low pressure for March as the storm intensifies Wednesday, and snowfall rates are forecast to top an inch per hour in the Midwest, snarling travel. The storm is now pushing east into the Northeast. The likes of interior New York and New England facing treacherous conditions, with post-frontal winds keeping the cold locked in.
Many should expect blizzards, freezing temps, and/or dangerous winds over the next few days. Wind chills are dangerously low in the north. Stay off the roads, is the official advice in affected regions, and bundle up — winter isn’t done yet.

Rapid Cooling In Antarctica
Antarctica is experiencing a significant temperature drop with minimums plunging to anomalous lows for the time of year.
Concordia logged -61.6C (-78.9F) on March 4, with Vostok dropping even further to -62.3C (-80.1F). Dome Fuji AWS also registered a sub -60C low, coming in at -61.C (-77.8F).
March 4 also marked the first day of the year where maximum temperatures remained below -50C (-58F). Vostok posted a high of just -51.6C (-60.9F) — an extreme anomaly.

Antarctica’s March cooling is stark, and it continues the intensifying trend of the past few years.
Go Nuclear Or Shut-up
If climate alarmists were actually serious about reducing carbon emissions while maintaining reliable energy, nuclear power would be the answer. As per the data, it’s the safest, cleanest, most efficient, and least land-intensive energy source going.
The Case For Nuclear
1) Nuclear energy has the lowest death rate per terawatt-hour (TWh) of electricity produced—lower than coal, oil, biomass, natural gas, and even wind and solar.
2) Nuclear emits just 6 tons of CO2 per gigawatt-hour (GWh), compared to coal (970 tons), oil (720 tons), and natural gas (440 tons). Even solar and wind have higher emissions over their lifecycle than nuclear.
3) A single 10-gram uranium fuel pellet produces as much energy as 1 ton of coal, 120 gallons of oil, or 17,000 cubic feet of natural gas.
4) Nuclear plants operate at full power 93% of the time, outperforming solar (23%) and wind (33%).
5) A 1,000 MW nuclear plant occupies just over 1 square mile and can power 775,000 homes. To match that output a solar farm would require 6,000 acres but only power 193,000 homes; a wind farm 32,000 acres to power 277,000 homes. Wind and solar not only take up vastly more space but also require battery storage due to their intermittency, further increasing land and resource demands.
Nuclear energy offers the ONLY reliable, scalable, and ‘environmentally responsible’ path to clean energy, if that’s your goal. Wind and solar, while good for small, off-grid solutions, cannot match nuclear’s efficiency, reliability, and land conservation benefits.
Study Challenges Pre-Industrial 280 ppm CO2 Assumptions
For decades now, scientists have insisted that before the Industrial Revolution, Earth’s atmosphere contained just 280 parts per million (ppm) of carbon dioxide (CO2). This figure has been treated as an unquestionable baseline, forming the foundation of claims that human activity alone is responsible for rising CO2 levels today. But independent researcher Dai Ato claims this assumption is deeply flawed, arguing that the so-called “evidence” underpinning it is riddled with inconsistencies, contradictions, and outright methodological failures.
The primary basis for the 280 ppm claim comes from Antarctic ice cores, where tiny air bubbles trapped in ancient ice are assumed to provide an accurate record of past atmospheric conditions. Yet, Ato’s study reveals glaring issues in this reconstruction. Ice core data is frequently “adjusted,” with gas ages shifted forward to align with modern CO2 trends, he says.
The data itself is incomplete, showing abrupt and inexplicable CO2 spikes and drops before 1950 that defy any logical connection to human emissions. If these figures were accurate, they would indicate natural CO2 absorption and release processes so extreme that they would completely invalidate the idea that human emissions are the primary driver of atmospheric CO2 levels.
Adding to the problem, historical chemical measurements and plant-based reconstructions suggest that past CO2 levels may have been significantly higher than 280 ppm, contradicting the conveniently smoothed ice core data. Worse still, Ato exposes how climate models deliberately ignore natural CO2 fluctuations driven by ocean temperatures, volcanic activity, and other environmental factors.
Additionally, Ato details how ice core data from Greenland and Antarctica diverge dramatically, despite modern CO2 levels supposedly remaining similar across both poles. If today’s atmospheric CO2 is relatively uniform worldwide, why would past CO2 levels differ so drastically between ice cores?
Ato’s analysis uses multiple regression models to test whether human emissions have any measurable impact on atmospheric CO2. His results? No significant correlation. Instead, sea surface temperatures (SST) alone explain CO2 fluctuations. This aligns with basic physics—warmer oceans release more CO2, cooler oceans absorb it. Climate models that ignore this fundamental reality are not just misleading but fundamentally broken. They are junk.
The study argues that human emissions are not the dominant force behind rising CO2 levels. If the 280 ppm assumption is indeed a fabrication propped up by flawed ice core reconstructions, then the entire AGW theory must be re-examined. Natural processes govern CO2 fluctuations far more than human activity, is Alto’s key point, and the refusal by establishment scientists to even look into this as a possibility exposes the modern climate narrative as dogma-driven storytelling, not science.
For a full read of the study, click here.

Ore-industrial CO2 at 280ppm…
CO2 In 1900 was at 300ppm. 5% = man-made = 15ppm.
Today we have 425ppm CO2. At 5% being man-made means 21ppm, an increase of 6ppm over 125 years.
(All are approximates, 5% is chosen for ease of math.)
Since 1960 CO2 was at 317ppm. (sealevel.info/co2)
It is now 425ppm (+/-).
108ppm in 65yrs. 5% of that is Man-made- Again, 6ppm of atmospheric CO2
And 100ppm+ is Naturally occurring!
Heck Tony Heller shoed a study that about 30 Million yrs ago CO2 was at 3000+ and it was an ICE AGE! So the little Mammals must have been driving coal powered Match Box cars EH?!?
You can calculate the effect of CO2 on Earth’s temperature when you know the following:
Water vapor warms the Earth by 30 degrees Celsius.
If the percentage of water vapor in the atmosphere is 1% and CO2 is 0.0425%
Multiply the percentage of water vapor by how many times stronger the greenhouse gas effect of water vapor is compared to CO2.
Then calculate the ratio of water vapor to CO2 and transfer this ratio to 30 degrees Celsius.
Do the same with the increase in CO2 from the year 1900 to today’s date.
The answer you get is how much CO2 raises the Earth’s temperature.
Pre-industrial CO2 at 280ppm…
CO2 In 1900 was at 300ppm. 5% = man-made = 15ppm.
Today we have 425ppm CO2. At 5% being man-made means 21ppm, an increase of 6ppm over 125 years.
(All are approximates, 5% is chosen for ease of math.)
Since 1960 CO2 was at 317ppm. (sealevel.info/co2)
It is now 425ppm (+/-).
108ppm in 65yrs. 5% of that is Man-made- Again, 6ppm of atmospheric CO2
And 100ppm+ is Naturally occurring!
Another research on the accuracy of historically CO2 in ice cores.
“….the air enclosed in a given ice layer does not originate from a single point in time but rather is characterized by a continuous age distribution covering tens to hundreds of years”.
.
Research on the smoothing of CO2/methane data from ice cores, the values measured from ice cores are an “..average value over a certain period of time, which removes the fast variability from the record ” + closing of air in ice layer can take tens to hundreds of years + the leaking of CO2 before the lock-in phase..:
.
.
“Consequently, the air enclosed in a given ice layer does not originate from a single point in time but rather is characterized by a continuous age distribution covering tens to hundreds of years (Schwander et al., 1988, 1993; Rommelaere et al., 1997).”
.
.
“Consequently, the gases trapped in a given ice layer span a distribution of ages. This means that the gas concentration in an ice layer is the average value over a certain period of time, which removes the fast variability from the record.”
.
.
The estimations of CO2 rates of change are further altered by the process of discrete measurement, and measured values can be 3 times lower than the actual atmospheric rate of change.”
.
.
“However, the gas records in low-accumulation ice cores cannot be interpreted as perfect records of the atmospheric history. Indeed, due to the process of gas trapping in the ice, two distinct effects create discrepancies between the actual history of the atmosphere and its imprint in the ice. The first one is due to the heterogeneous structure of the firn when transforming into airtight ice with bubbles” …….
.
.
“The second effect that creates differences between the atmosphere and its imprint in the ice is due to the combination of diffusive air mixing in the firn (Schwander, 1989) and the progressive closure of pores in a firn stratum (Schwander et al., 1993; Mitchell et al., 2015).”
———————————————————————————————————————————————- .
“Consequently, the air enclosed in a given ice layer does not originate from a single point in time but rather is characterized by a continuous age distribution covering tens to hundreds of years (Schwander et al., 1988, 1993; Rommelaere et al., 1997). Therefore, the concentration measured in an ice stratum is an average of atmospheric concentrations over a period of time. This effect removes the fast variability from the record and has therefore been referred to as the smoothing effect (Spahni et al., 2003; Joos and Spahni, 2008; Köhler et al., 2011; Ahn et al., 2014; Fourteau et al., 2017)”
———————————————————————–
Source (and links/references to the paper/research): ————————————————————————————————
https://cp.copernicus.org/articles/16/503/2020/ ————————————————————————————————-
Fourteau, K., Martinerie, P., Faïn, X., Ekaykin, A. A., Chappellaz, J., and Lipenkov, V.: Estimation of gas record alteration in very low-accumulation ice cores, Clim. Past, 16, 503–522, https://doi.org/10.5194/cp-16-503-2020, 2020
+
About mean values in ice cores- https://www.youtube.com/watch?v=qNSPiMmuIvI&t=478s
No Vostok dropped to -62.8C (-81F). I found it on the chart.
The arguments about greenhouse gas levels are irrelevant. The laws of physics are clear on this issue.
CO2 – Scammers gonna scam.
But not the GSM guys,
thank you