Snow Hits Parts Of South Africa For First Time In 40 Years; Scotland Sees Snow; Evidence For Solar-Driven Weakening Of The Jet Stream; + Global Temperature Drop
“This year’s weather has been a blessing for the glaciers.”
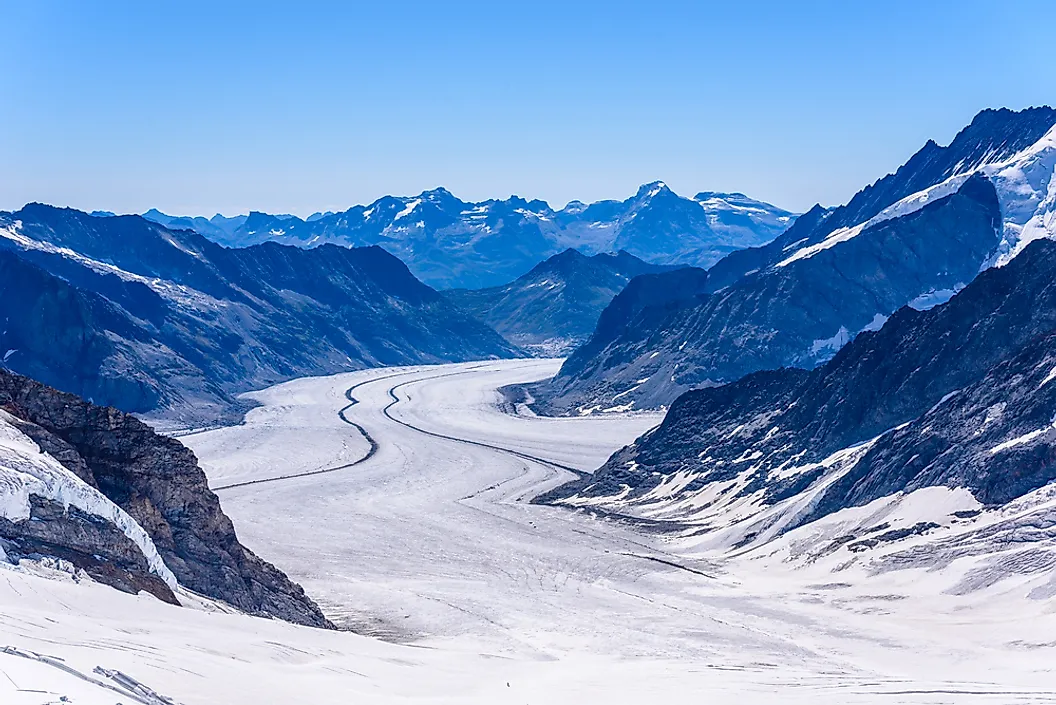
“This year’s weather has been a blessing for the glaciers.”

...it has been programmed with all the 'correct' phrases and statistics, but, in turn, is held back by censorship and a crippling obstruction to logic.

Cities are hotter than their rural surroundings, and increasingly so -- this is an undisputed yet rug-swept fact.
If this cooling trend holds, it could mark the beginning of a new phase in Earth’s climate.
 Unlock with Patreon
Steve’s brother has been found ..
https://www.esa.int/Applications/Observing_the_Earth/FutureEO/Swarm/Swarm_helps_discover_Steve_s_long-lost_twin?utm_source=join1440&utm_medium=email&utm_placement=newsletter
what am I looking at with the GLA ? It doesn’t look like a temp drop but a lowering of the rate of increase? Can someone explain this to me?
Ok CAP is bringing up important info on the Jet Stream north to south flow.
If cold lobes of air push further into the south and warmer air mass moves unexpectedly higher into northern latitudes. If it is winter won’t that warm air mass be exposed to shorted days much shorter in some cases? That is allowing overnight radiation for far more nighttime hours. Aver-all you could make a case for contributing to global cooling. A pump bringing warm air north into a wider radiation window.
How many X and M class solar flares were there last month? When was the last month with that many? How many X and M class solar flares this year so far? When was the last year there were that many the first five months of a year?
You forgot to tell us there would be a test, Teach.😏
SC status data request,
What’s SC? (she asked, at the risk of looking like an idiot.)
SC25, Solar cycle 25. Solar cycle counts the number of sunspots per month. Sunspots are cooler areas on the Sun, the dark spot cooler than the surrounding area. One sunspot might put out no flares or a thousand so counting sunspots in not a good reflection of solar flare solar activity.
The month of May 2024 had the most sunspots in 22 years, now top article on Space Weather.com. What about the solar flare count for the month of May 2024? Where does that rank? How about for the year so far?
https://spaceweathergallery2.com/indiv_upload.php?upload_id=209090
I can’t find any place online that is counting the total number of solar flares. Maybe I just don’t know where to look.
However, if one would play back Ben Davidson’s daily update on SO for every day in May, one could count them oneself, because he mentioned every single one. Smart, hunh? Lol.🌞
What’s all this ‘qualifying’ stuff to be able to read more…. I already open the electroverse link….. This is becoming suspiciously elitist!!!
Interesting little Country in S Africa where the snow is, Lesotho the Mountain Kingdom in the sky. The Alps of S Africa, mountains to 11k ft some yet scaled due to gnarlyness and it snows year round at upper elevations. No trees on the pic yesterday barren wasteland in a flurry in the Magic Mountain Kingdom in the sky. 116F up North. 120F forecast over in Bagdad from solar flares.
https://en.wikipedia.org/wiki/Lesotho
https://www.windy.com/-Menu/menu?snowcover,2024061018,-29.789,28.216,8,i:pressure,m:cOdagVN
Why does the UAH temperature chart bear no resemblance to USCRN, USCRN being the most accurate land based temperature dataset ever recorded?
Why does the UAH temperature chart match the Guardians fake climate emergency nonsense?
For goodness sake.
The USCRN only covers 3% of the Earth’s surface, or it may be 3% of land I cant remember which. There’s 2 data sets, the longer running one is badly affected by UHI, other poor station siting and given it’s run by NOAA I would rule out some “adjustments” aka data tampering. The more accurate one uses 50 relatively new stations sited to minimise UHI effects but has only been operation for about 13 years and shows far less warming, or maybe even slight cooling, than the other one. Guess which one is by far the most widely publicised.
SOHO showing Venus going behind the Sun and solar flares. When Tonga erupted from a solar flare, Venus was between Earth and the Sun. Mercury was about to go between Earth and Venus and the Sun, a double Mercury in retrograde.
Mercury goes between Jupiter and the Sun on the 9th and then goes between Venus and the Sun a week later. The Sun’s polarities are prime for solar activity, same pattern as last month for the biggest N lights show I have ever seen.
https://soho.nascom.nasa.gov/data/LATEST/current_c2.gif
https://gong.nso.edu/data/magmap/QR/bqG/202406/mrbqG240605/mrbqG240605t2204c2285_257.gif
https://gong.nso.edu/data/magmap/combo_gmodel_movie.html
https://sdo.gsfc.nasa.gov/assets/img/latest/latest_2048_0193.jpg
https://solarham.com/pictures/2024/jun5_2024_filament.gif
https://solarham.com/pictures/2024/jun5_2024_cme.jpg
You might want to keep a running total of solar flares this month if you can’t find a total anywhere online.
Ben Davidson mentions the large flares, I can find them on the SolarHam list but it doesn’t have all the official recorded X and M class solar flares count for May or for the year and the comparable past data.
Top solar flare SC25: https://solarham.com/top10.htm
List solar flares SC24 &SC25 but not all the M class:
https://solarham.com/top10.txt
So what is less powerful than an M class, and are you even interested in those? It looks like no one else is.