A G2 geomagnetic storm was forecast for the weekend, and it happened — but questions have arisen.
At least one coronal mass ejection (CME) was supposed to hit Earth’s magnetic field on Saturday, Sept 2, however solar wind data show no clear signs of an impact. Whatever the reason for the storm, it sparked strong mid-latitude auroras in the USA.
“Last night was absolutely epic!” said Ethan Hohnke who shot the below photo near Empire, Michigan:

on September 2, 2023 @ Empire, Michigan (45th Parallel)
“Northern lights could be seen dancing over the waters of Lake Michigan before the bright Moon rose,” continued Hohnke. “I was standing near the 45th parallel when I took this picture.”
The lights spread even farther south than that, points out Dr Tony Phillips of spaceweather.com. The red glow of atomic-oxygen auroras were captured in Colorado (+38.9N) and Missouri (+38.6N), as shown below. In these southernmost locales, auroras were not visible to the naked eye, but were easily recorded by cameras with nighttime exposure settings.


Dr Phillips speculates that a CME did arrive on Sept 2, but that its weak impact was masked by an unsettled stream of solar wind already blowing around Earth. At this time of year, even weak CMEs do a good job sparking auroras–a result of the Russell-McPherron effect which boosts geomagnetic activity around the equinoxes.

And so to the crux of this article…
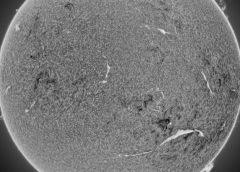
Has Solar Cycle 25 Already Peaked?
Compared to the preceding months, solar activity has fallen off a cliff. Output at the beginning of September is comparable to that of January 2022:

Speculation is rife that the maximum of Solar Cycle 25 is already behind us.
Even if this is the case, the cycle provided an impressive run-up, at least compared to its predecessor, the historically weak Solar Cycle 24 (the weakest cycle in more than a century) — the moving average of SC25 reached 117.9 in June, thus surpassing the maximum of SC24, the 116.4 recorded in April 2014.

While it is unlikely the max has been reached –not least because the inertial moving average will likely nudged SC25’s curve up a little further– it is certainly possible that the cycle has effectively topped.
We have many examples of solar cycles achieving their maxes early, such as cycles 15 and 18:


What is known is that solar activity has plunged of late.
Has Solar Cycle 25 peaked?
Time will tell.
I, personally, am hoping not.
Solar Cycle 26 is where I’ve long contended the chill of solar minimum gets underway, where the next ‘Grand Solar Minimum’ officially commences with all the struggles, strife and hardships such a period delivers, as per the historical documentation.
For us to already find ourselves on the downward-slope of SC25, well, that’s a concerning prospect.
Stay tuned for updates.


What is the significance of a short solar cycle?
Less solar energy from the Sun.
Weniger Energie. Instabile Jetstream. Grösseres Wetterchaos. Ernteausfälle, Kriege usw..
Polarity shift today:
https://gong.nso.edu/data/magmap/QR/bq7/202309/mrbq7230904/mrbq7230904t1504c2275_288.gif
https://gong.nso.edu/data/magmap/QR/bq6/202309/mrbq6230904/mrbq6230904t1504c2275_288.gif
I have had a look at those images and I am not sure what I am reading, or where my datapoint is. If you could enlighten me that would be awesome!
Kp5+ and mag spike over the weekend:
https://www.swpc.noaa.gov/products/planetary-k-index
https://firebasestorage.googleapis.com/v0/b/carrington-9.appspot.com/o/spaceWeatherNews%2Fgoes_mag.png?alt=media
https://firebasestorage.googleapis.com/v0/b/carrington-9.appspot.com/o/spaceWeatherNews%2Fgoes_proton.png?alt=media
https://firebasestorage.googleapis.com/v0/b/carrington-9.appspot.com/o/spaceWeatherNews%2Fgoes_electron.png?alt=media
Last century the Cromanhurst Observatory in Queensland, privately run by Inigo Jones, used sunspot activity for long-range weather forecasting for Australian farmers. Because he was so superior to the Bureau of Meteorology, many if not most farmers and pastoralists paid subscriptions to receive the forecasts. Not sure what happened after Inigo Jones died, but accurate long-range weather forecasting in Australia seems to have died with him, as the woke BOM is wildly inaccurate.
Polar Portal SMB link points to a twitter page, not polar portal.
NOAA forecasts that the sunspot number will start dropping in July of 2025 and go to zero and stay at zero until at least 2040 when their forecast ends. Fewer sunspots mean less solar output and cooler/colder weather.
https://www.swpc.noaa.gov/products/predicted-sunspot-number-and-radio-flux
Something odd with these figures – no trace of the 11 year cycle.
Is there a prediction for SC26 on that chart or does it go to zip because there isn’t one yet?
NOAA’s Space Weather Prediction Center is forecasting 0 sunspots from 2035 through 2040 (likely longer, but that’s a far as their outlook covers).
https://www.swpc.noaa.gov/products/predicted-sunspot-number-and-radio-flux
What I find interesting is the difference in the socalled Layman’s count of sunspots, and how we are counting these present days. I cannot help noticing a huge difference in both methods. Personally I believe that so numbers of SC 24 and 25 are ramped up by the use of modern instruments, and that the actual numbers are way lower. Just look at the enormous sway of the polar vortex, I have never seen the vortex that low on the globe. I’ll give you an example, last week on Tenerife Spain temperatures were around 28 C, but due to the enormous dampness it felt like 32, 33C. That dampness arose from a strong southern wind, originating in the Sahara desert, then traveling thousend of km’s over the Atlantic, to then hit Tenerife. Even the locals could not remember weather conditions like that for decennia.. My guess, the swirling polar vortex, due to a very low sunspot count..
Recent solar wind spike third highest in a year from solar activity produced heat waves which have cold fronts. There were major hurricanes and typhoons from solar activity last month which are now storms. The next hurricane forecast cat 5 track it next two weeks. Mercury goes by Jupiter end of this week get ready for more flares and more cyclones.
http://solen.info/solar/images/swind.png
https://www.windy.com/-Show—add-more-layers/overlays?gust,2023091118,21.238,-64.567,6,i:pressure,m:ejAaenV
https://www.solarham.net/pictures/2023/sep1_2023_m1.jpg
I prefer to compare the SC25 to the SC23, the solar cycles go in pairs.
That said, we have to wait and see if the decline in activity is confirmed.
This year, in the south of Italy, in Calabria, we had heat strokes, close to 42°C, but which did not last. The average temperature stabilized around 30°C at an altitude of 500 m. Moreover the hills are green from 300 m altitude. It’s quite exceptional.
For 4 weeks, we have been sailing around 25°C. It is very exceptional.
I know that the time scale is too short, but for a few years our summers have been less intense, this one in particular.
If you look at the Butterfly diagram, most the spots are concentrating below the 20th latitudess
https://www.spaceweatherlive.com/en/solar-activity/solar-cycle.html