
More Blatant NOAA Obfuscation; + A Novel Look At Global Hurricane Data Reveal No Trend
Below is a revisit of two articles originally posted in 2021 on the now censored electroverse.net…
More Blatant NOAA Obfuscation
February 2021 was a month of historic cold across large parts of the planet.
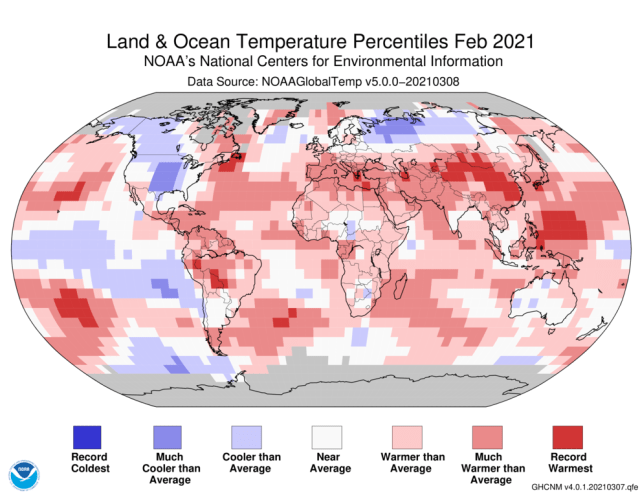
Even NOAA, with their crafty, data-fudging and UHI-ignoring ways have shown the month to be exceptionally chilly — although you wouldn’t get that impression if you all you had access to was their absurd “percentiles” map:

However, when circumventing NOAA’s obfuscation and breaking down the agency’s data, it is revealed that the North America continent endured its chilliest February since 1994, with the contiguous U.S. suffering its coldest Feb since 1989 and its 19th coldest in record books dating all the way back to 1895.
The Southern Hemisphere also got in on the cold act, too, posting its chilliest month of Feb since 2012.
ALL of central and northern Asia froze.
While large parts of Africa, Southern Asia, and South America also experienced colder-than-average months.
NOAA’s rarely cited “departures from average” map gives a far better indication of the state of play in February, 2021:

Below I’ve embedded a direct comparison of the maps to help demonstrate NOAA’s intentional muddiness.
Note: the two maps use the exact same data over the exact same timeframe, yet they give wildly differing impressions of the month (see the “whiting out” on the percentiles map where there is clearly “blue” on the departure map):

A Novel Look At Global Hurricane Data Reveal No Trend
Experienced data analyst, 10-year Wall Street veteran, and self-proclaimed “Mrs. Smarty Pants”, Zoe Phin of phzoe.com takes a look at the alarmists’ claim that “increasing CO2 emissions are leading to more frequent and intense hurricanes”.
Phin has already dealt with this re Atlantic hurricanes (linked here), and found no trend.
Today, she analyzes the global data.
It is definitely true that the number of detected hurricanes has increased, writes Phin on her blog.
This is due to better sensing technology.
But aside from detection, there is also a matter of how one counts the frequency of hurricanes.
Does it make sense to count a 6-hour Category 3 storm the same as a 42-hour Category 3 storm?

No! It’s doesn’t make sense.
Such a thing would be misleading.
But that is exactly what climate alarmists do.
A better thing to do, continues Phin, would be to count the hours spent in certain wind speed categories.
And this is exactly what she did.
So, below are the results from the best hurricane data in the world.
[Note, 10yr CMA means 10-Year Centered Moving Average]
Category 1 is cyclic/no-trend:

Category 2 had increased, but dropped during the past 25 years:

Category 3 had increased, but dropped during the past 25 years; while Category 4 is cyclic/no-trend:


And Category 5 has actually DECREASED:

Featured below is the combined data for category 1,2,3,4,5 hurricanes.
Overall, it reveals no trend — just natural, cyclic motions:

Zoe Phin’s results will come as no surprise to those privy to the actual data, rather than just the bleats of the IPCC and their propagandizing MSM lapdogs — and a host of other leading scientists have reached the same conclusions: that is, that hurricanes have not been getting stronger or more frequent.
For example, here’s Klotzbach et al (2018):

And here’s NOAA’s Dr. Ryan Maue, who cites Dr. Roger Pielke Jr. re global cyclone activity since 1970:

The alarmist claim is that greenhouse gases create more energy for hurricanes, writes Phin.
Well, she asks, where exactly is all that extra energy for hurricanes?

I like the US Landfalling Hurricanes graphic the best.
In July 2003 I moved to SW Florida, parking the 18 wheeler behind Albertsons (now closed) in Venice Fl on July 4th, calling the company telling them they can have their truck back. I have been in this tri-city area ever since.
I call the years 2004-2005 the hurricane years as we would have a hurricane every two weeks four at a time!!! Now that seems to be a marker year for this chart. Notice prior to those years the 4/year peaks are straight across, since then we have dropped to 3/year. Now that 3 years of La Nina ended with no hurricanes in August 2022 with Ian on 28th Sept the coming El Nino trend is supposed to be good for LESS hurricane activity. We may not have an El Nino as I suspect but there is certainly a change towards the cooling has occurred.
This morning the temps are gradually edging up with a 68 F but still NOT over my “normal” 72 for the 15th of May marker. Some fluffy low clouds may get us some rain. It’s dry but not near as dry as those 2005-2010 years.
Dallas